Open Source · Apache 2.0 · 419/419 Tests Passing
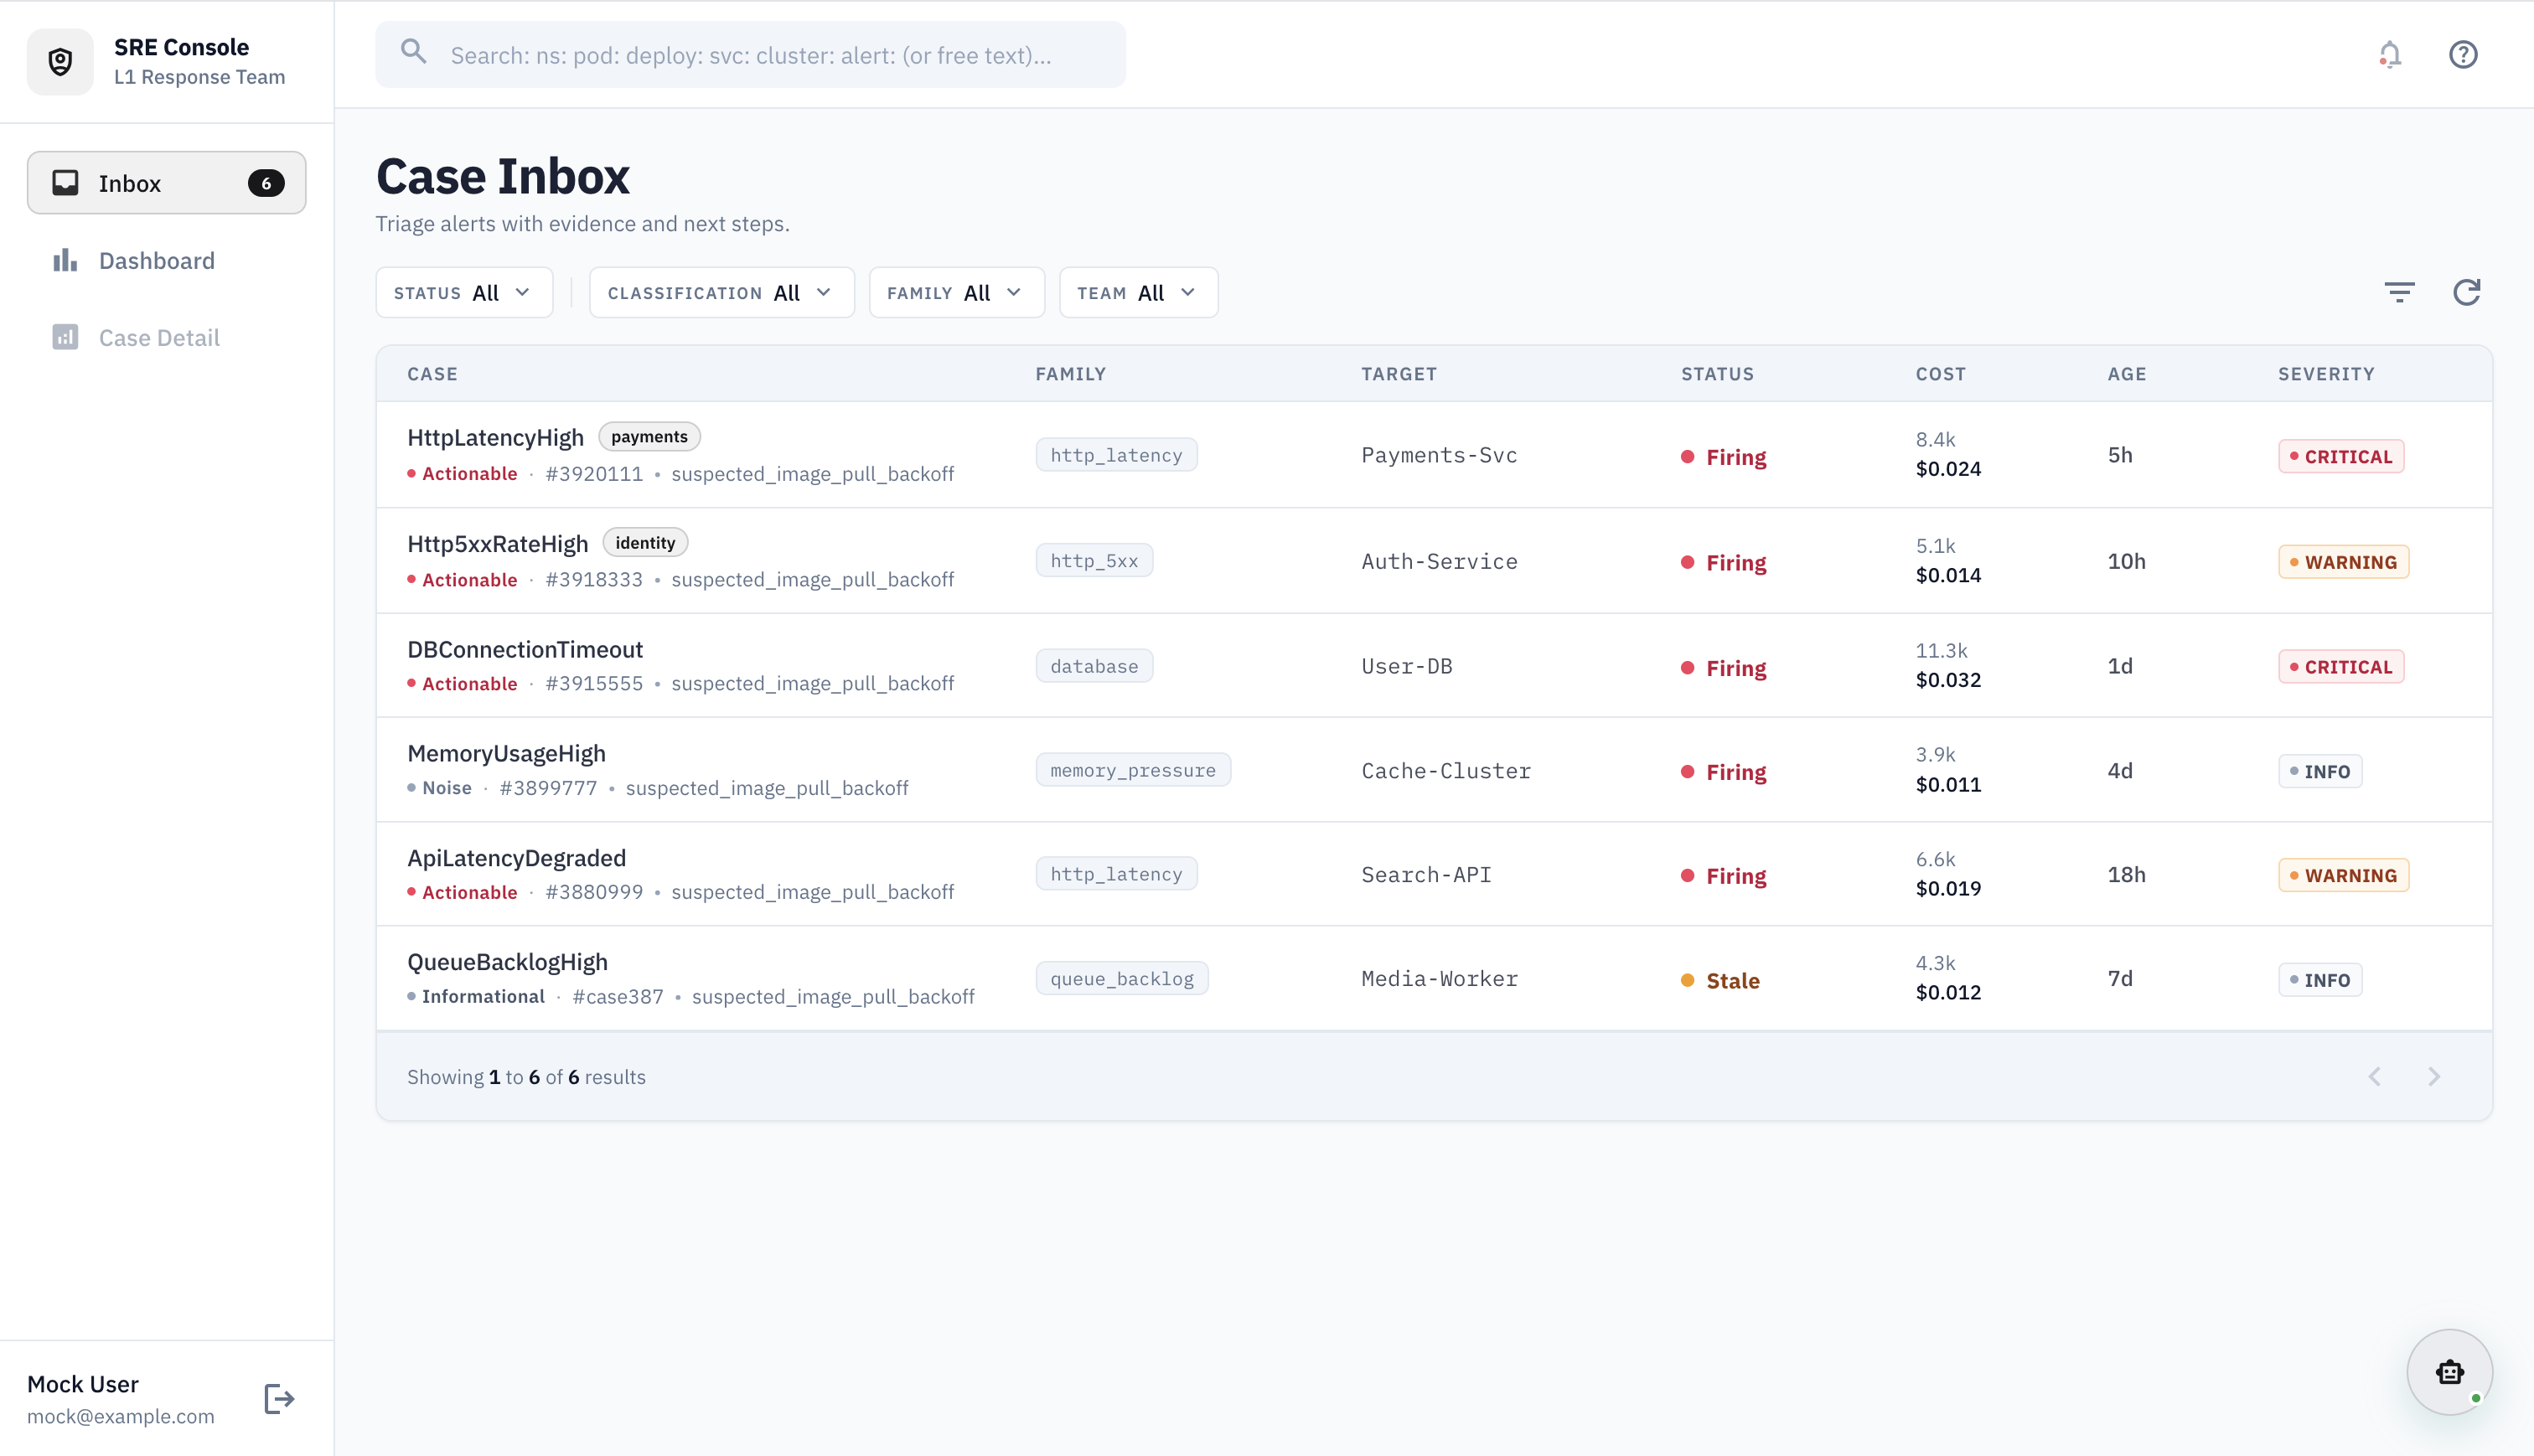
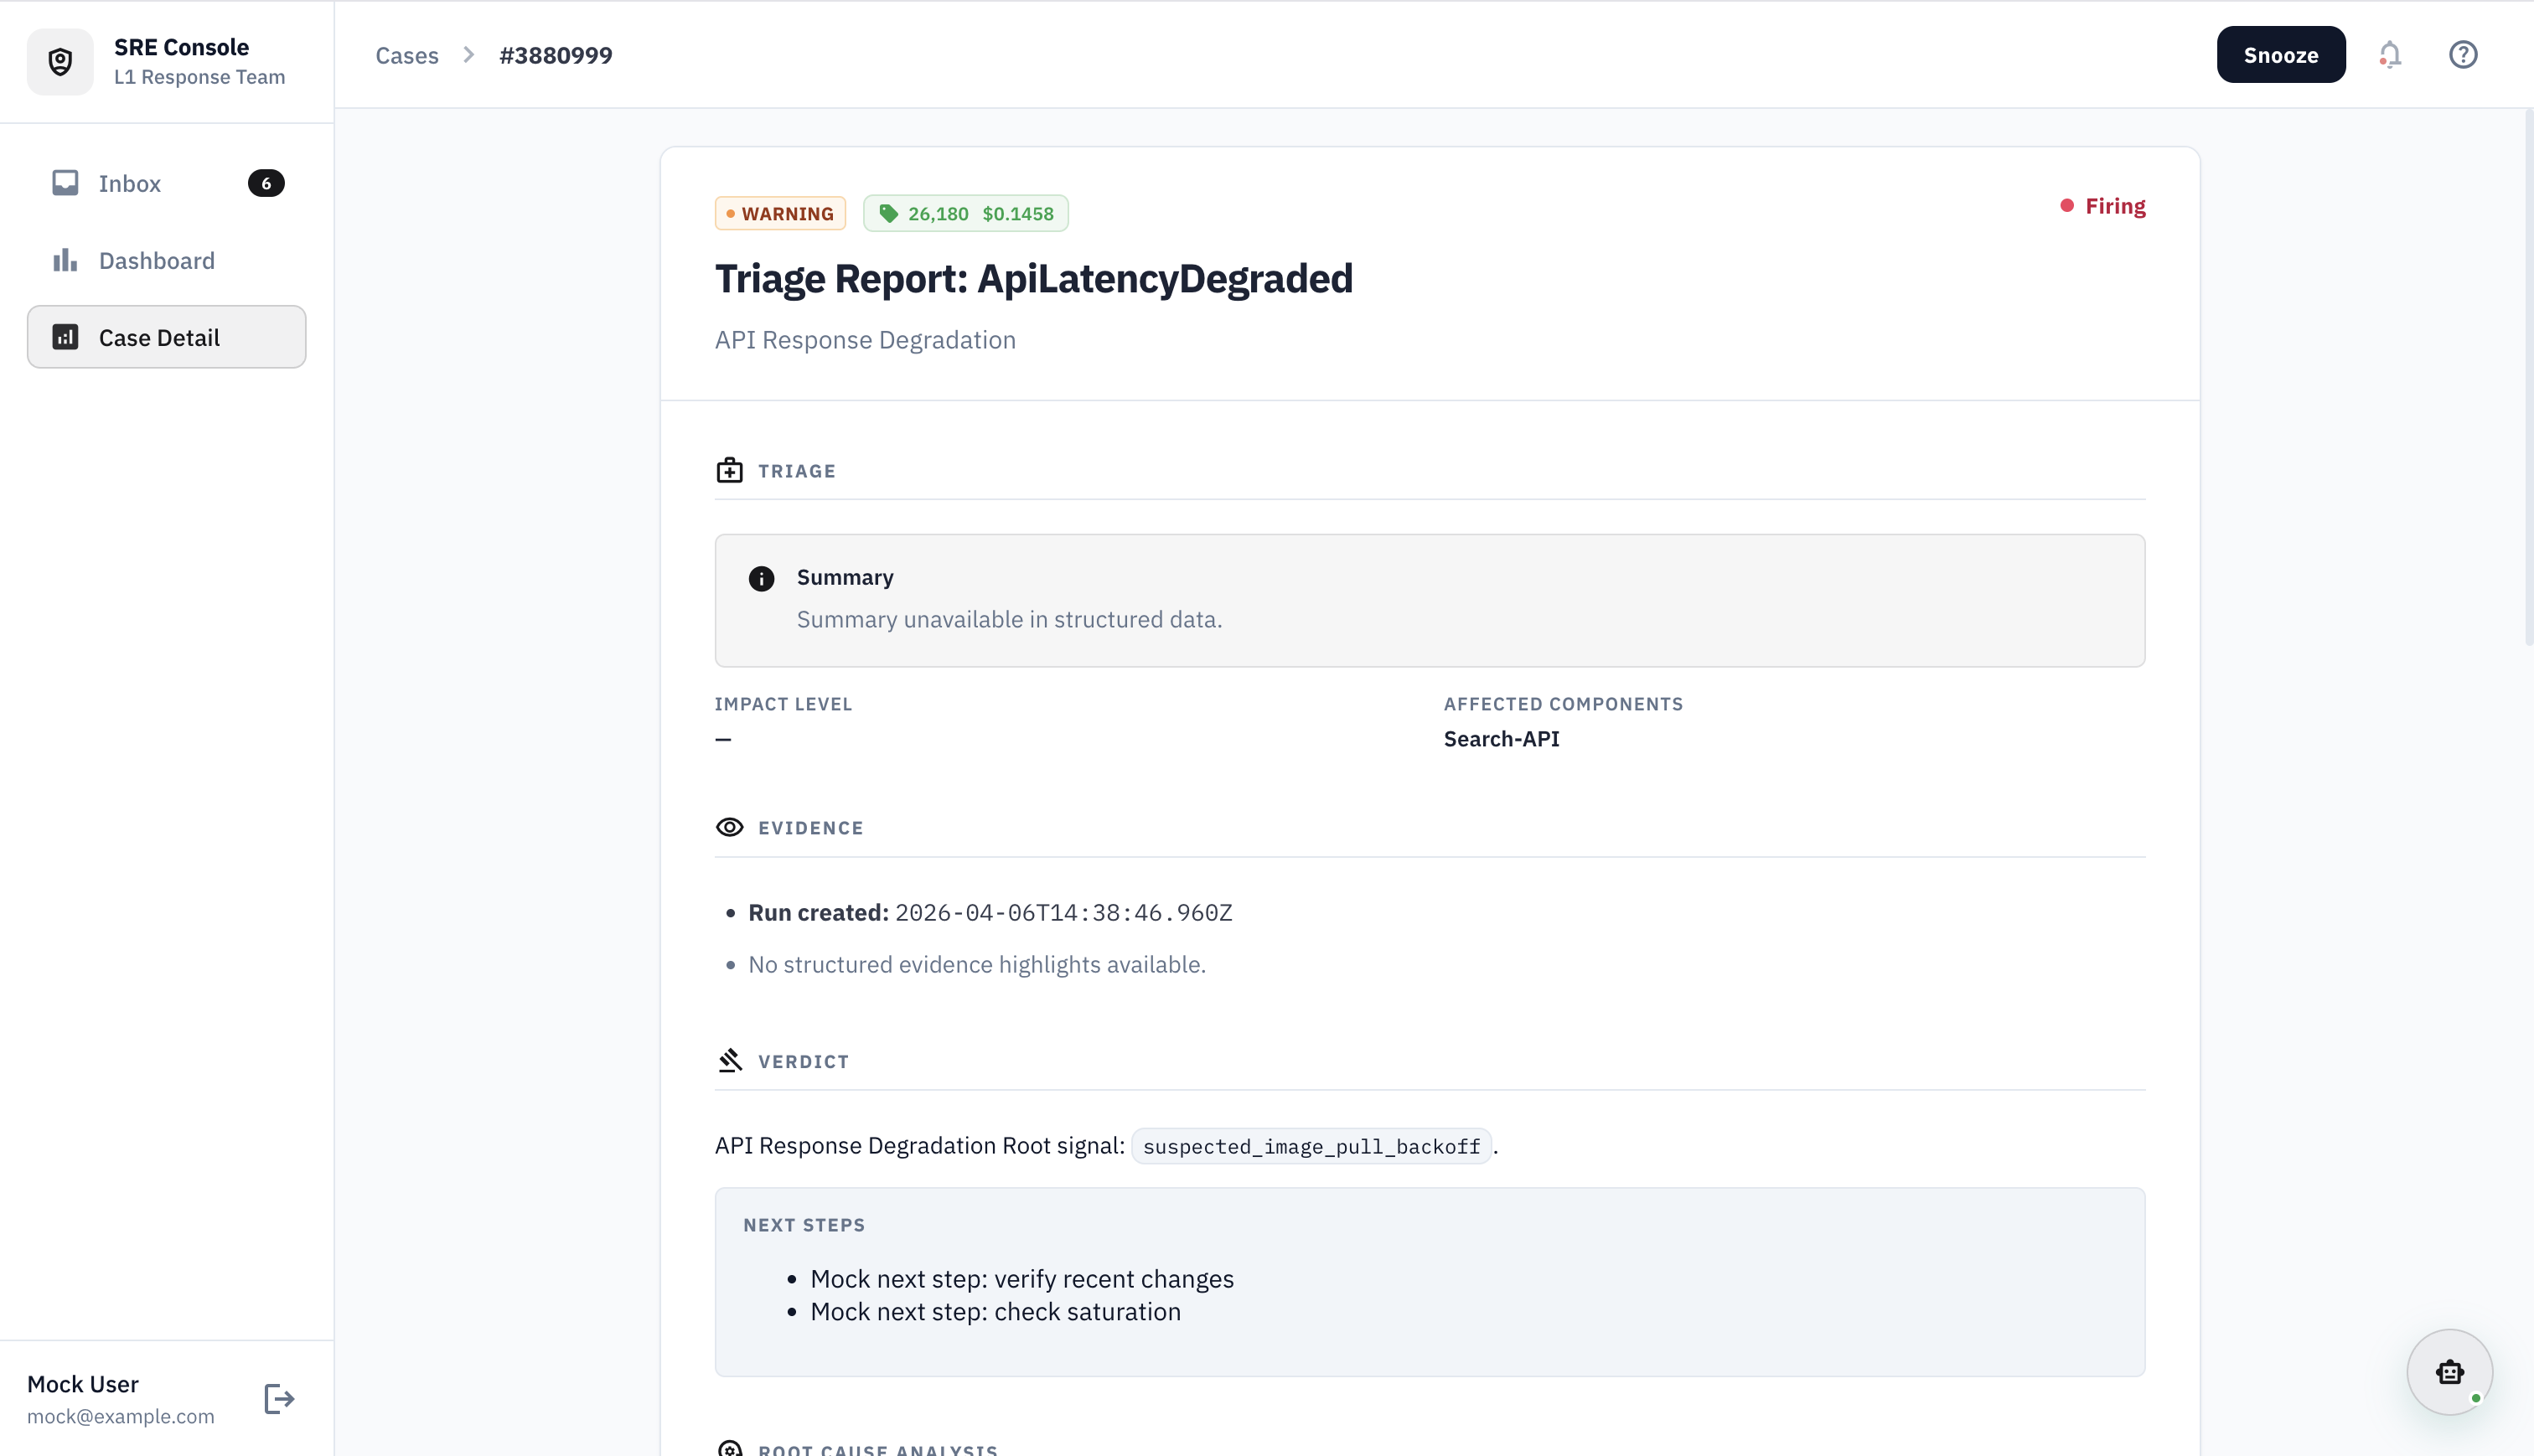
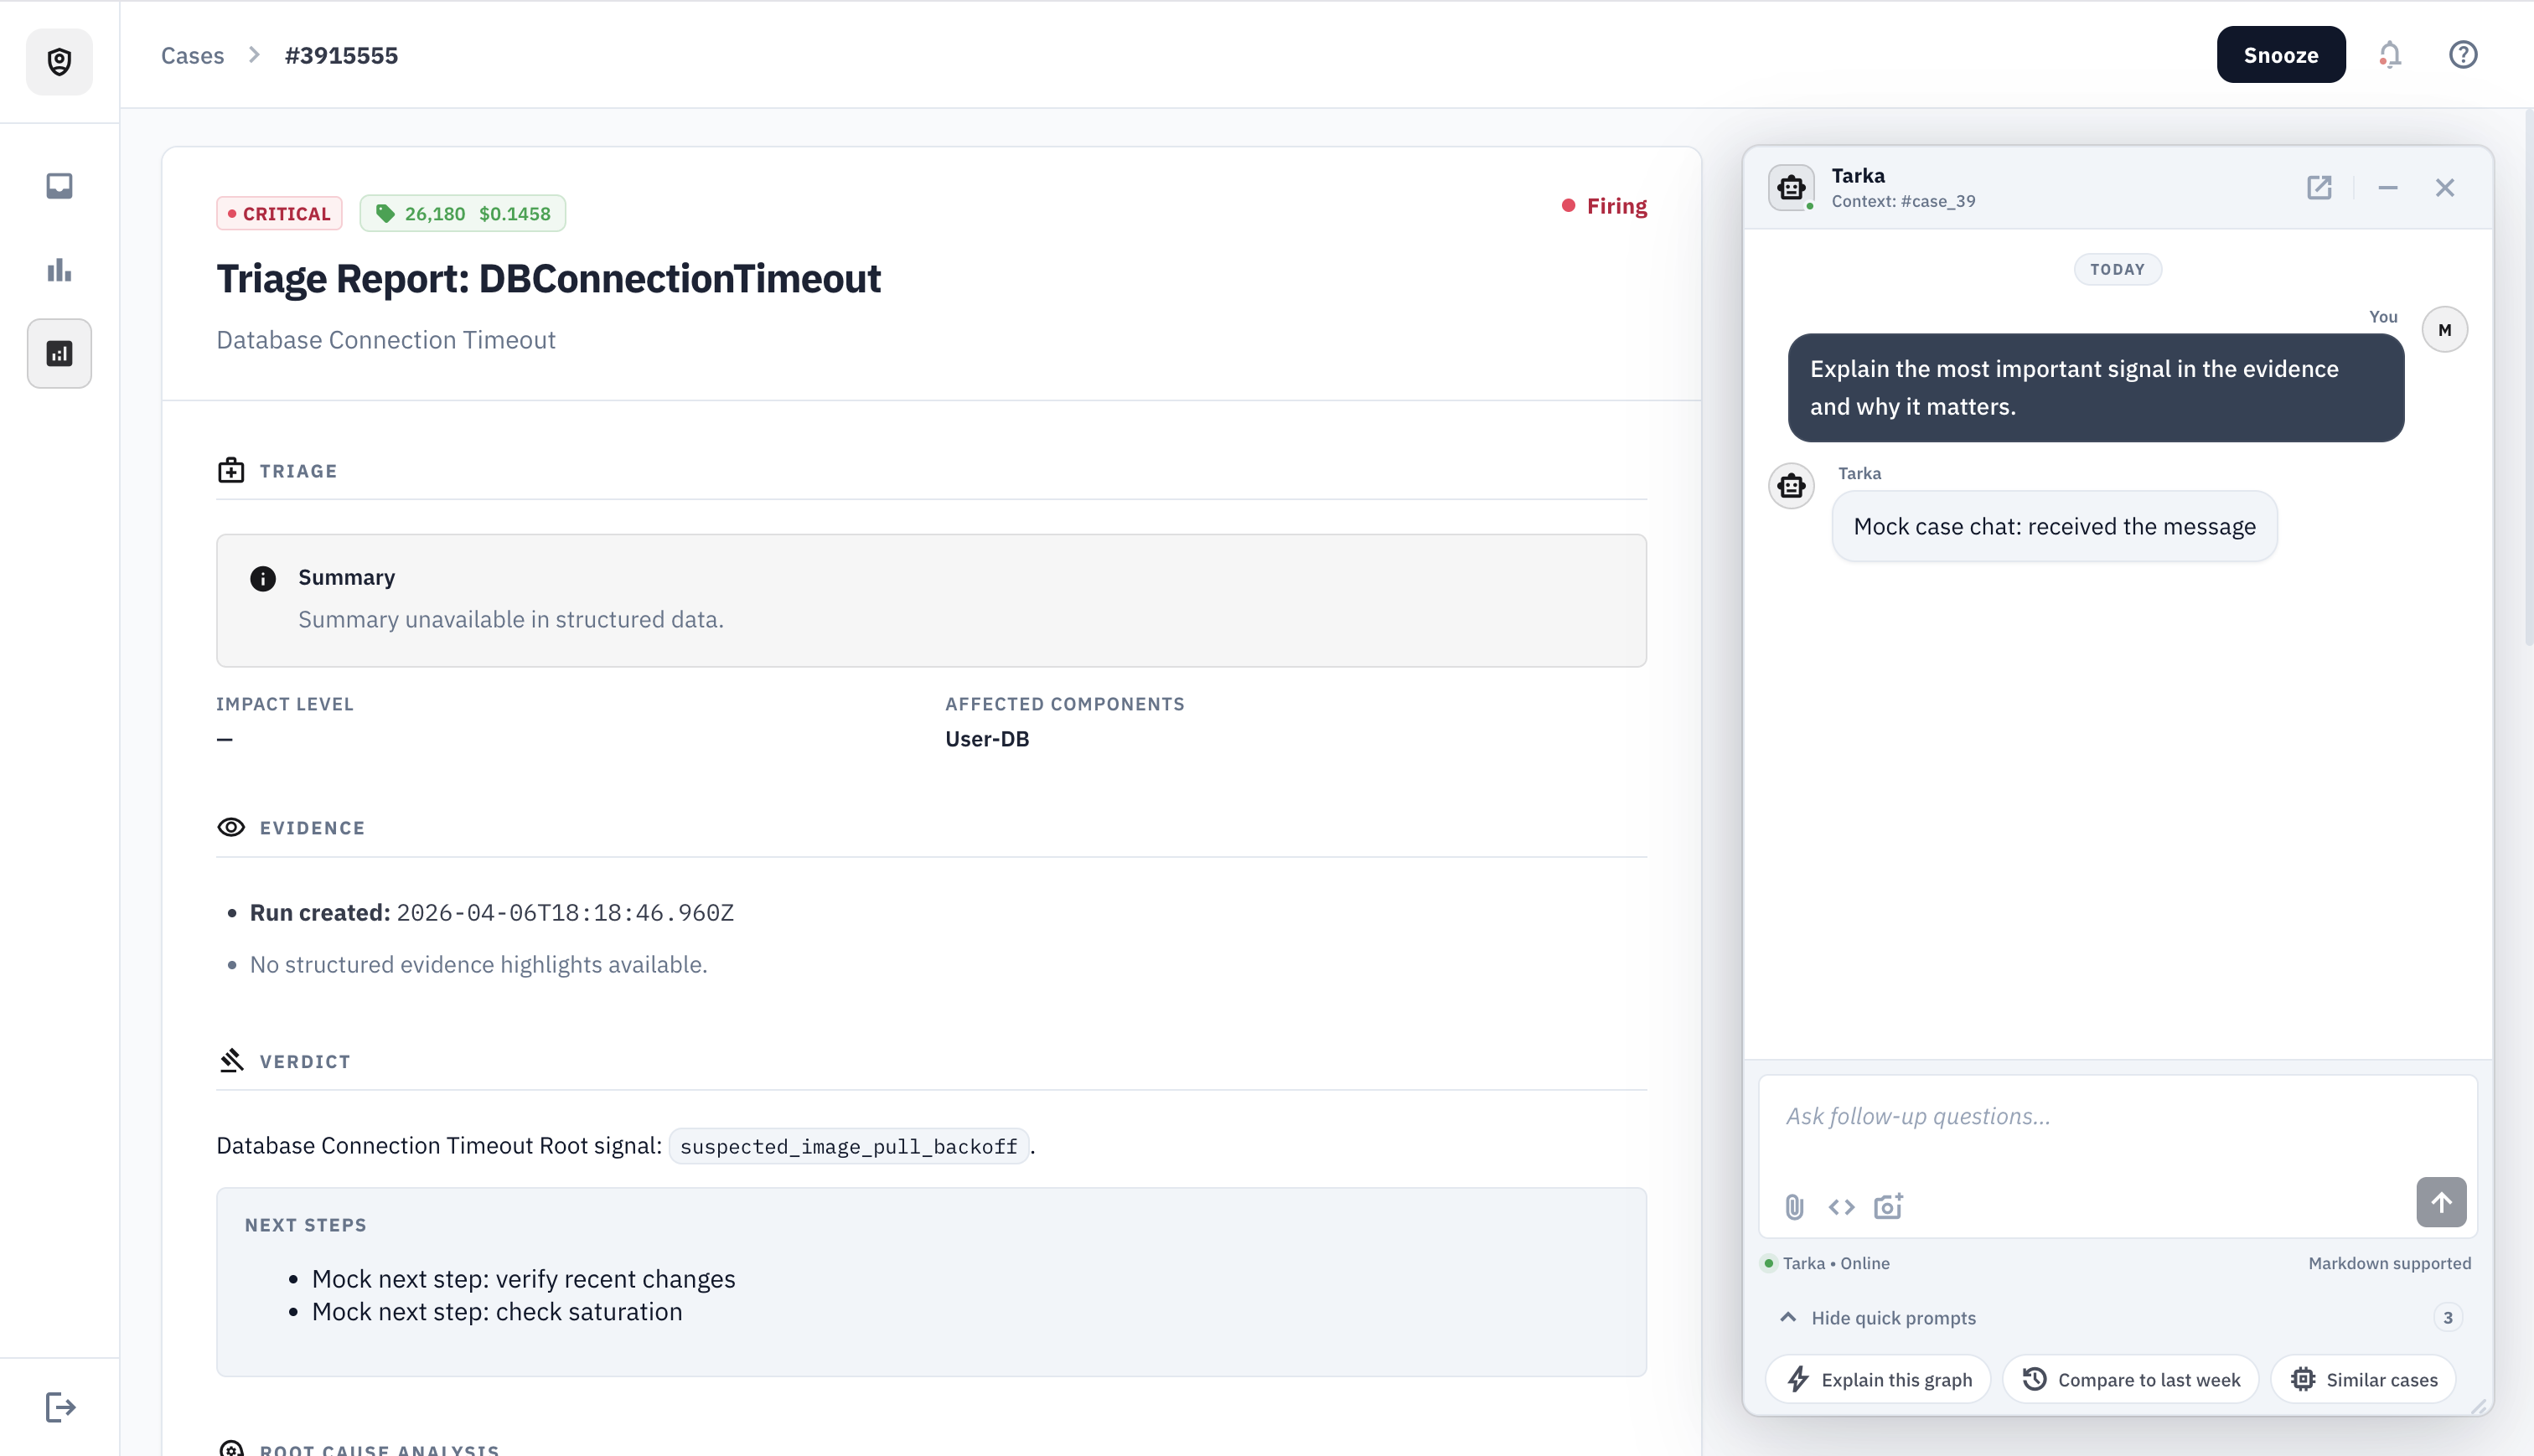
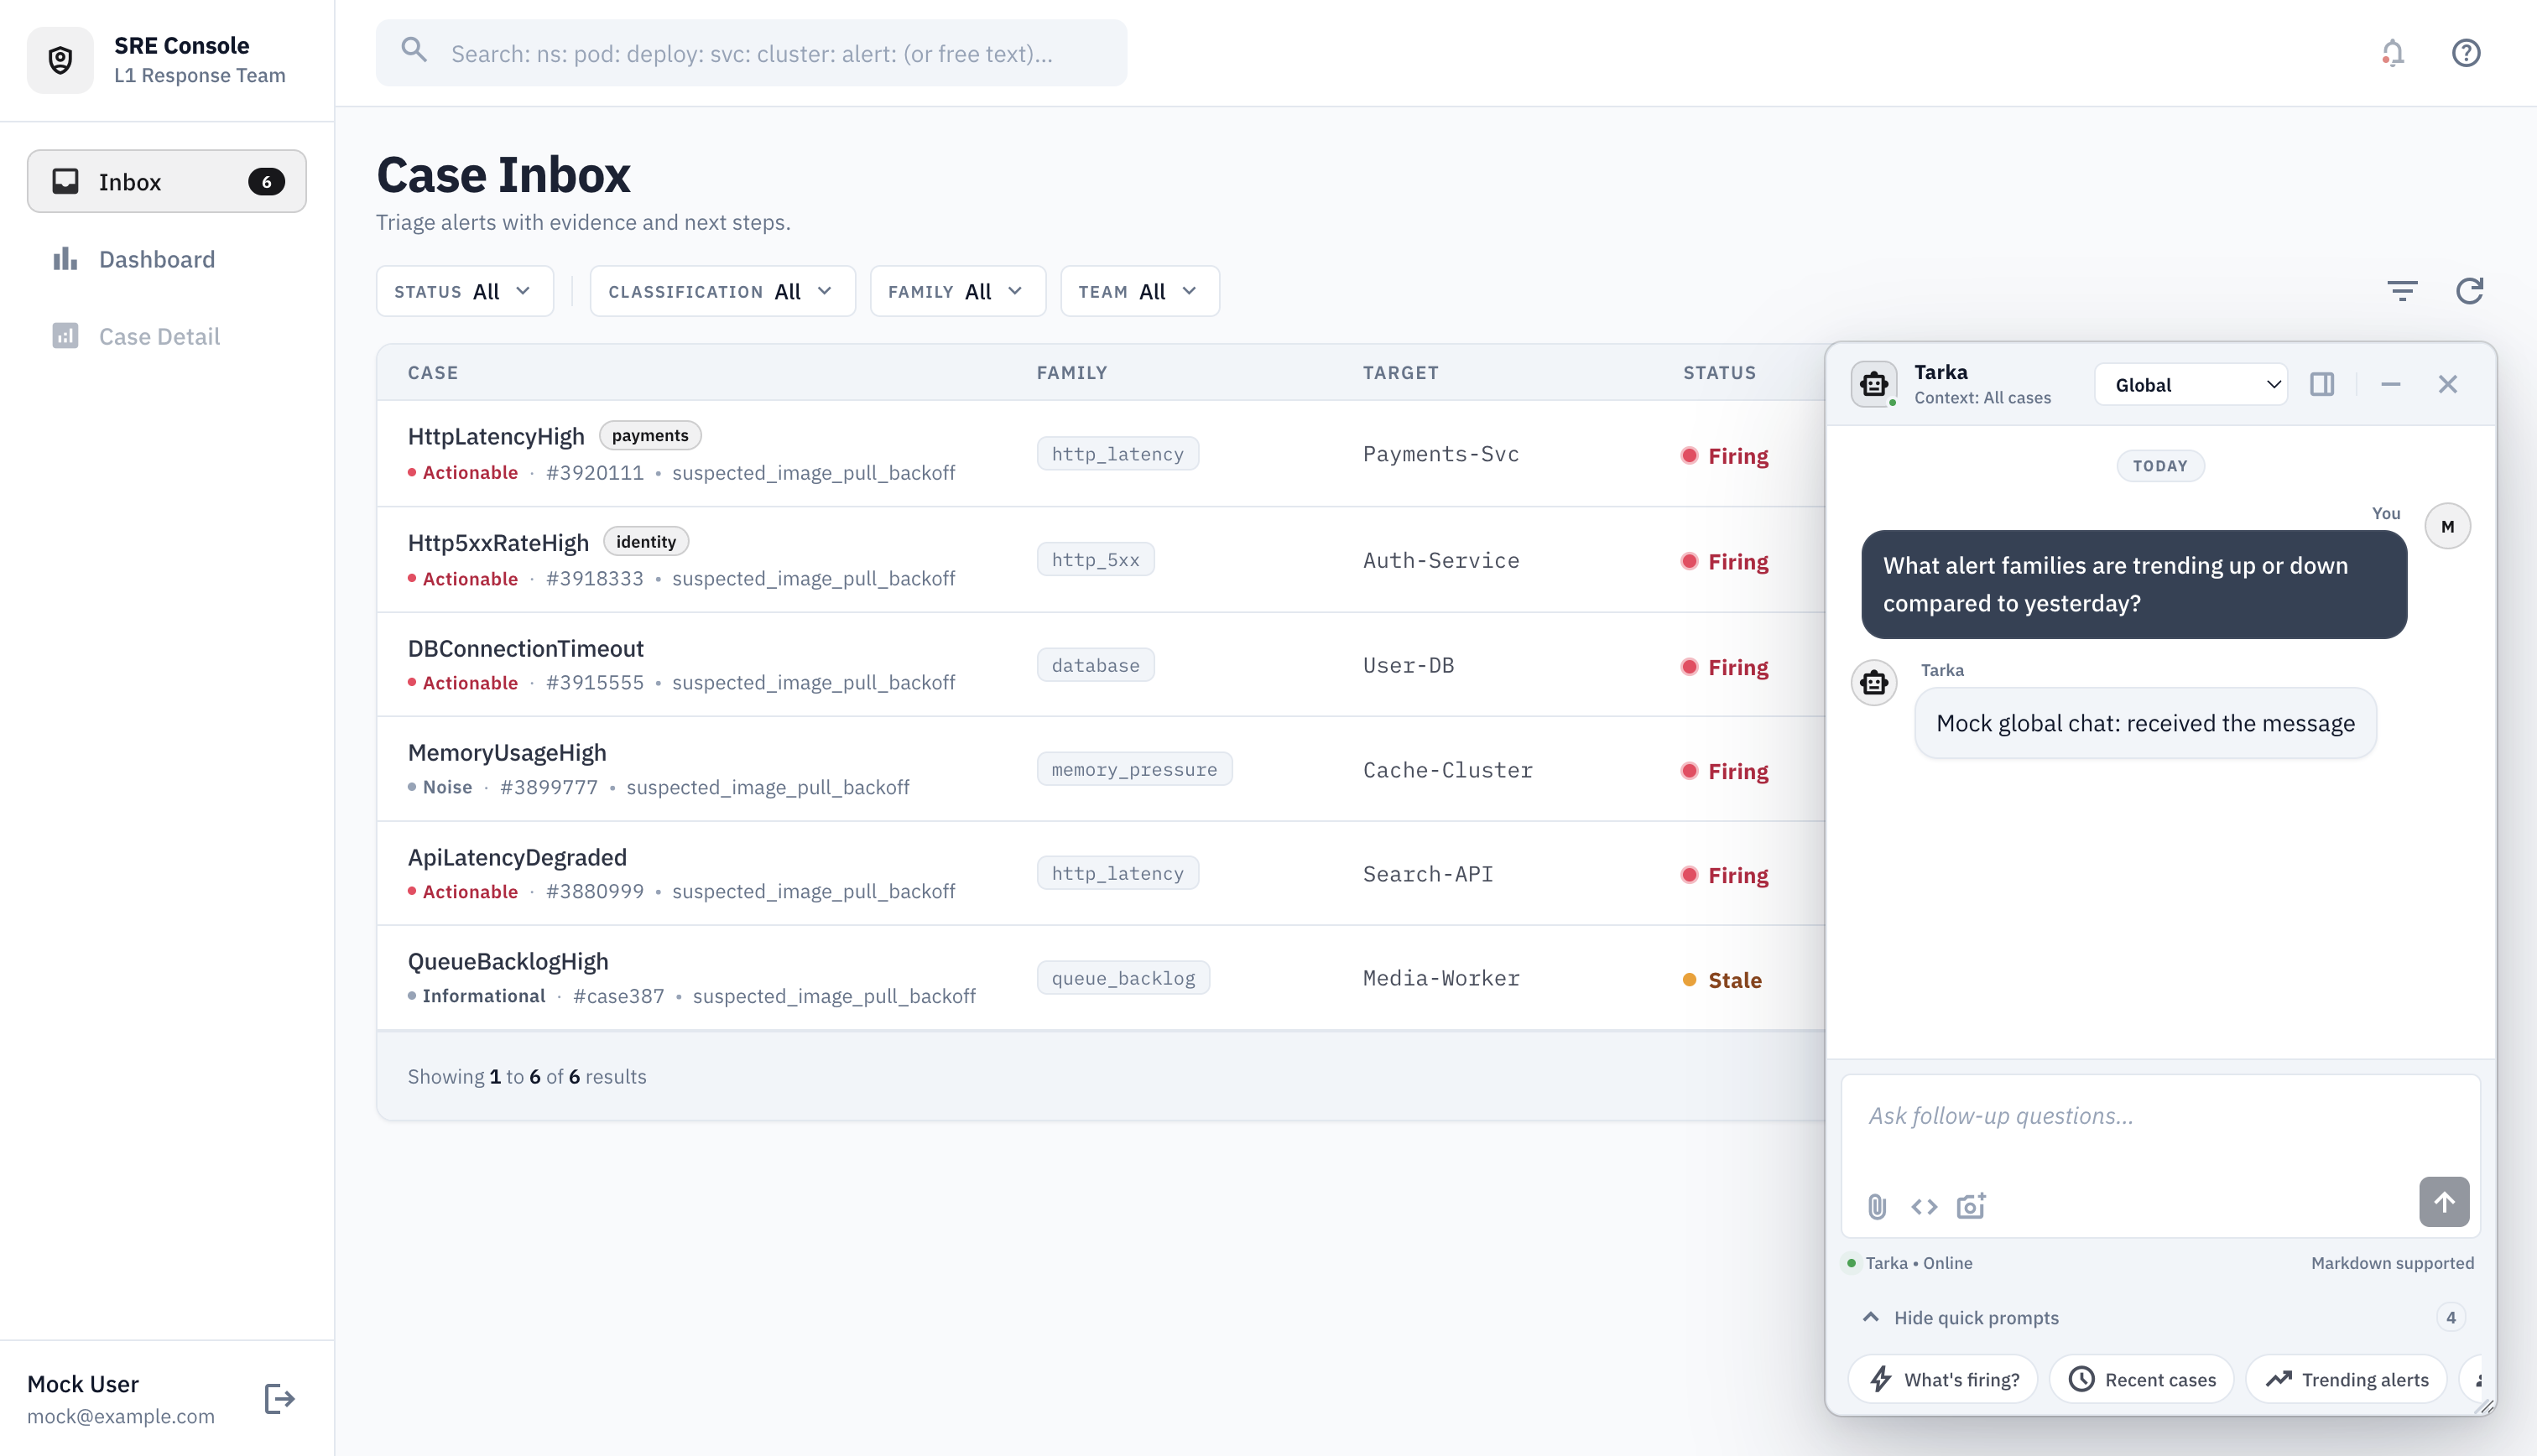
Turn an alert into
an investigation
in 60 seconds.
Tarka converts Prometheus/Alertmanager alerts into structured triage reports — evidence, confidence-ranked hypotheses, and copy-paste-ready commands. No guessing. Just signal.